Snapshot of Bainbridge Island Housing Market

Bainbridge Island Harvest Fair – sponsored by Friends of the Farm
September 23, 2010
Bainbridge Gardens’ 17th Annual Pumpkin Walk
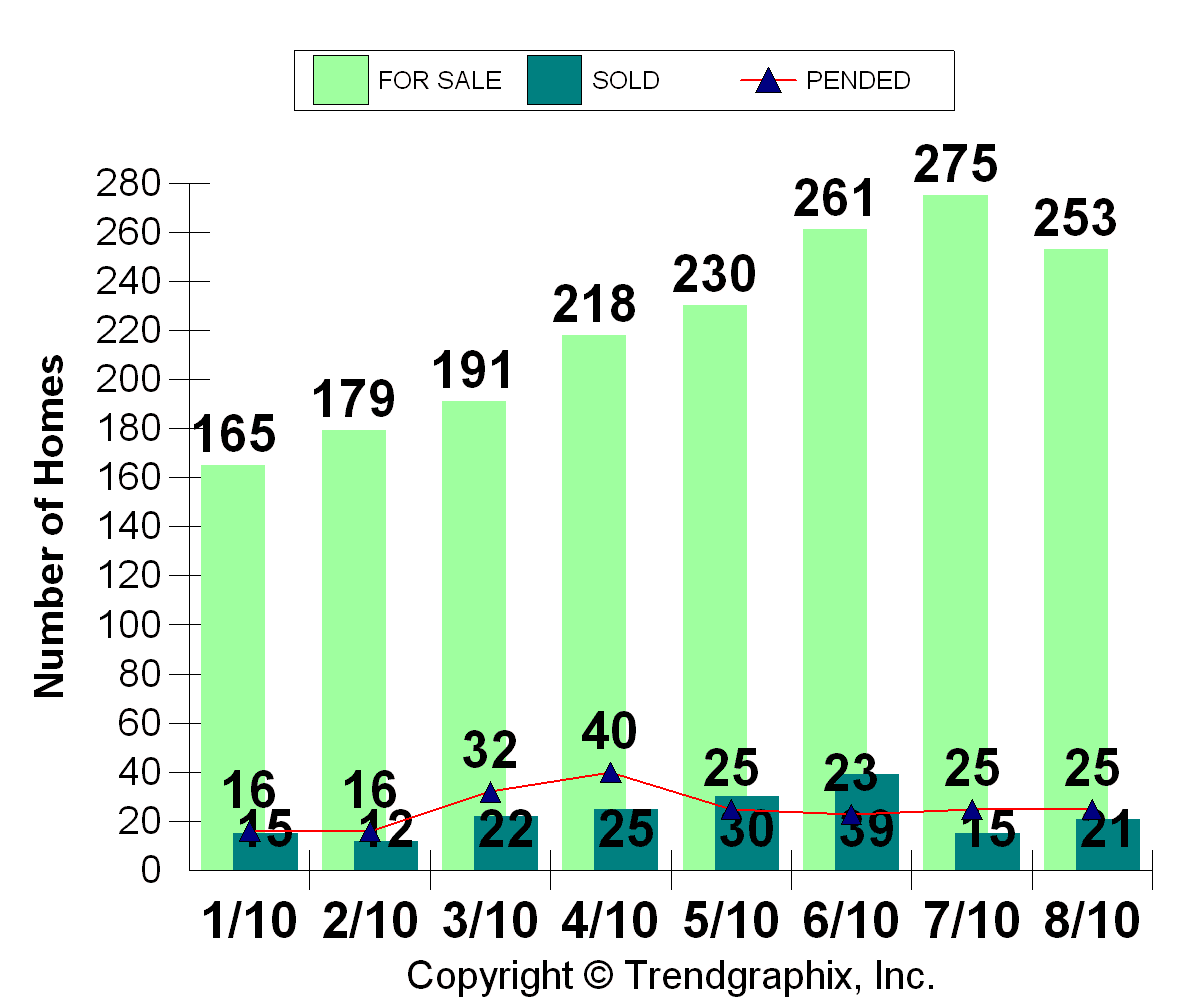
September 27, 2010The chart below compares single family homes on Bainbridge Island – For Sale vs. Sold vs. Pended. You can see we had an inventory spike in July, which follows the seasonal trend of high inventory in the summer. The current inventory number for September is 238, so we are already back below where we were in June. In regards to sales, April was our best month with 40 closings, the summer pretty steady with about 25 homes sold/closed per month. This month so far we have had 14 closings.
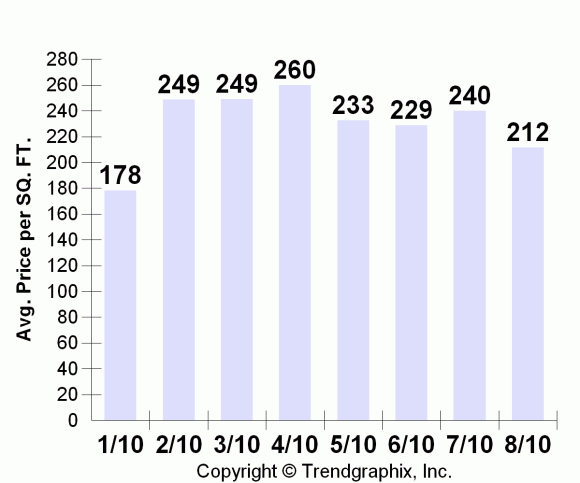
The second chart here looks at price per square foot. While our price per square foot can chart a bit wildly because of waterfront homes that can sell for $600 a square foot, this chart for the year so far is mildly steady. However, I do find it interesting that in our month of highest inventory, July, we was also saw an uptick in price per square foot (there was one sale of waterfront for $556 a foot in July) . I like everyone else am curious how the year will wrap up, especially in regards to price per square foot.
My prediction is we will settle in at the $200 per foot threshold and stay there for a while. Why don’t I think it will just fall out the bottom? Yes, there will be more short sales and bank owned properties on the market in the coming year, but sellers who do not have to sell are really hunkering down. Folks are renting, folks are refinancing, folks are living on one salary. People are making many changes before they have to take a huge hit on their house. Here on Bainbridge Island when we see new (not stale inventory from last year) come on the market it gets folks attention and if it is priced correctly, it sells within 30 days. That also goes the same for stale inventory. If something reappeared this summer that was on last year, it was typically priced correctly and it too sold rather quickly. So, I predict a tighter inventory with increasingly more correct pricing will keep our market clipping along – even during the tough months that are ahead for our national economy.

