More . . . Bainbridge Island Housing Data from 2007-2010

Bainbridge Island Pancake Breakfast Oct. 9th
October 5, 2010
So, what are buyers looking for anyway?
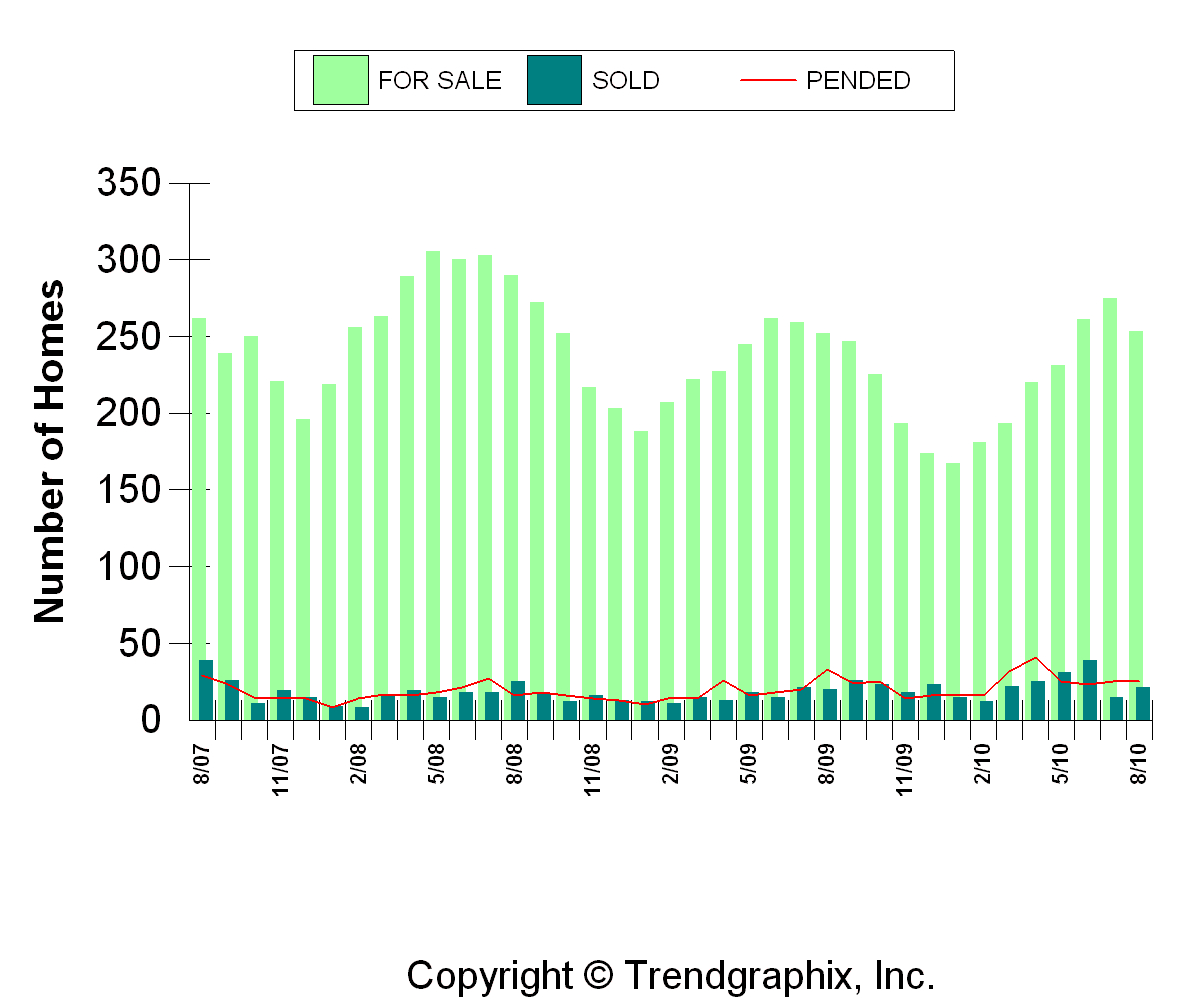
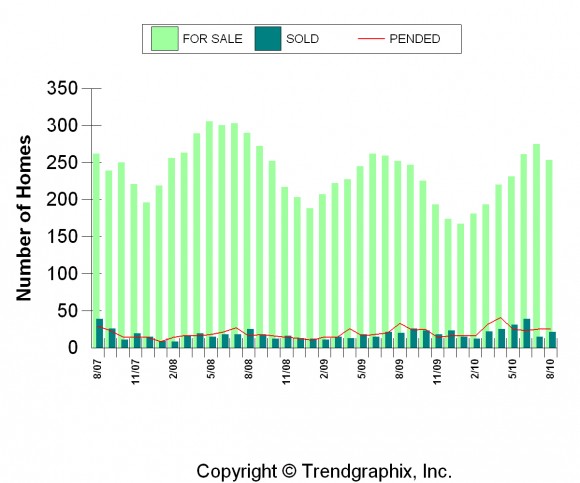
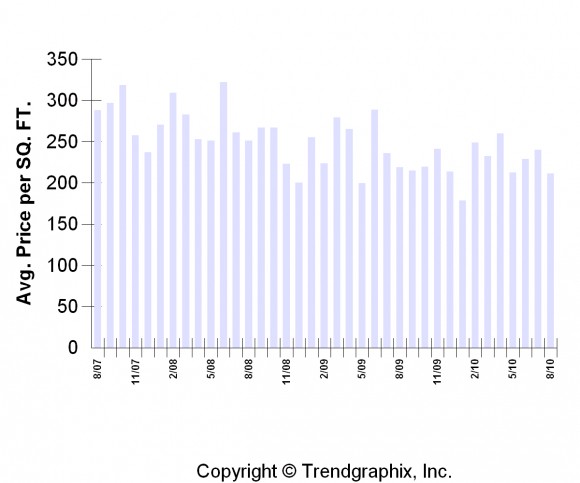
October 9, 2010These graphs take a step back and look at the last three years. We are certainly on a downward trend in regards to price per square foot, but we see that irregular, erratic market at play through all of the seasons. Winter months like December of 2008 and January of 2009 prices dipped down below the latest data from August of 2010, yet in February of 2008, there was an upward spike in price per square foot, followed by the highest of the three years in June of 2008. And, as I pointed out in the last data post, we saw spikes in the volume of homes sold this past summer of 2010 – likely due to the tax credit. Stay tuned as we finish out the year.
For Sale vs. Sold vs. Pended 2007-2010
Average Price Per Square Foot 2007-2010
The pricing data used below is for homes priced up to 2 million.
Related posts
January 23, 2026


