Housing Prices? Where are they Going? Let’s Look at Where They’ve Been

Local Farms Still Offer Bounty for Fall
October 12, 2008
Current Foreclosure Rate in Washington Not as Bad as 2002
October 25, 2008
Data: Standard & Poor’s
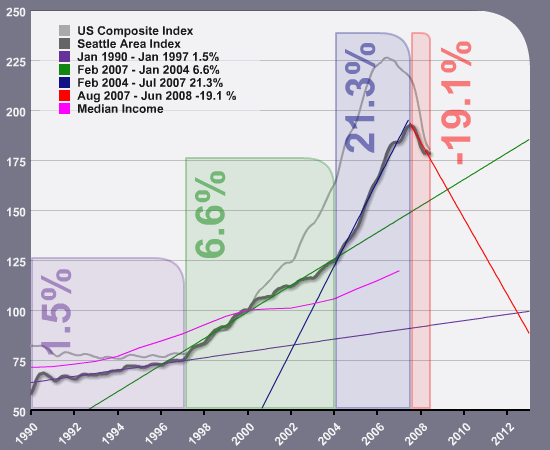
Everyone who owns a home or is thinking of buying a home is watching the housing market very closely. We can not predict the future, but, educated guesses can be made by looking back at history. I made this chart up using information from the Standard and Poor’s Index. It is Seattle specific.
Basically, this chart illustrates the rate of increase in home prices since 1990. Back in the 90’s the purple bar illustrates that from January 1990 to January 1997 housing prices increased an average of 1.5% per year. Very sane and slow. In the late 90’s, when we bought our first home, things started to pick up. The green bar shows that from February 1997 to January 2004 housing prices rose at a rate of 6.6% per year. In 2004, prices started to go crazy. The blue bar illustrates that from February 2004 to July 2007 housing prices rose at an average of 21.3% per year. Homes quickly became out of reach for many as housing prices shot up, while salaries jogged along at their same old rate. Affordable housing slipped away.
The shift started at summer’s end in 2007. The red bar shows that in August 2007 to June 2008 housing prices declined at -19.1% per year. It looks a lot like a free fall. When will it end? To answer that question with any kind of logic, we need to look at the rate of increases before the fall. On the chart, the bars also have lines that are their same color. The lines are an extrapolation of the increase rate.
So, we want to look at where this current drop will meet back, with the older, slower, saner, rate of increases. Our current rate of decline will meet back with the 6.6% rate of increase around April of 2009. Things could hook up there and housing could jog steadily along at the 6.6% rate of increase from then on. Or, prices may continue to drop. The current rate of decline will reach the 1.5% rate of increase around July of 2012.
Historically, the purple bar and the green bar represent basically, the same amount of time in years. My educated prediction is that prices will stop dropping somewhere between the 6.6% and the 1.5%, likely in 2010.
Should you wait until then to buy or sell? Like I have said in earlier posts, you have to look at all things considered. First, your price range. Drops are more significant in some ranges versus others. Are you renting? Are you spending/losing $30K a year on rent? And you have to look at income tax deductions. If you are renting, you are not able to deduct your mortgage interest. For many that is also $25-30K a year in deductions off you income. I know that is huge for us.
To answer your own personal question you have to look at all your considerations. I know that right now, the buyers have a lot of elbow room in the market. A lot of selection, a lot of power. As the tide turns, when prices stop dropping (right now they actually have, on the chart, the line has leveled out over the past two months) the climate of the market will change, likely to a level market, where it won’t truly be either a buyer’s or a seller’s market. We bought both our houses in a seller’s market. I know which market I’d like to shop in next time.


