Am I a Fortune Teller? No, I look at facts, let’s look at housing data from Standard & Poors

Looking Back, Moving Forward – December and 2009 Year End Housing Numbers on Bainbridge Island
January 12, 2010
In Search of the Vibe
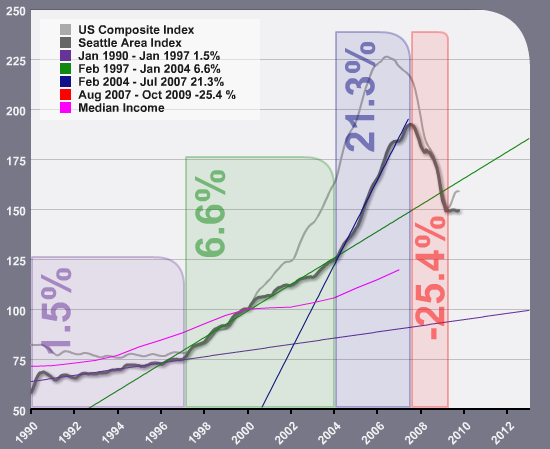
January 26, 2010Once again. In October of 2008, I wrote a post looking at the history of housing prices in the Seattle area. Since my clients are still asking me to predict the future (should we buy now or wait??) – I thought it was important to update this data to see exactly what prices have been doing.
Explanation of the chart with some housing history:
Basically, this chart illustrates the rate of increase in home prices since 1990. Back in the 90’s the purple bar illustrates that from January 1990 to January 1997 housing prices increased an average of 1.5% per year. Very sane and slow. In the late 90’s, when we bought our first home, things started to pick up. The green bar shows that from February 1997 to January 2004 housing prices rose at a rate of 6.6% per year. In 2004, prices started to go crazy. The blue bar illustrates that from February 2004 to July 2007 housing prices rose at an average of 21.3% per year. Homes quickly became out of reach for many as housing prices shot up, while salaries jogged along at their same old rate. Affordable housing slipped away.
The shift started at summer’s end in 2007. The red bar shows that in August 2007 to June 2008 housing prices declined at -19.1% per year. It looks a lot like a free fall. When will it end? To answer that question with any kind of logic, we need to look at the rate of increases before the fall. On the chart, the bars also have lines that are their same color. The lines are an extrapolation of the increase rate.
So, we want to look at where this current drop will meet back, with the older, slower, saner, rate of increases.

So, what’s happening now?
Since I last posted in October of 2008, prices continued to drop, and dropped at an average yearly rate of over 25% until the first quarter of 2009. Then as you can see with the dark grey line, prices have stabilized – they are jogging along at a steady pace. The light grey line in the US Housing Composite Index, and overall in the US, prices are going back up. In the last post I predicted a more steady decline, however, the unemployment rate and the economy as a whole took a blast in 2008, which I am sure explains the dramatic drop in the red bar. If Seattle follows the US, we could certainly head back up to the 6.6% rate of increase line and see an uptick in prices. Or, we could stabilize and head for a meeting with the median income, which seems like a logical prediction, since our economy and how people are viewing and spending money, has become just that, logical and now a little more predictable.
Seattle’s median housing price ($321,500) is of course significantly higher than the US ($178,000), which I think explains whey we are not going up right now, we were already higher to being with. Current median price data from the National Association of Realtors.
Normal, please
Yes, normal and stable would be great. All in all, I do believe that is what 2010 will serve up. So, is it a good time to buy? With the Expanded Housing Credit and amazingly low interest rates, my answer is yes.
Data reproduced with permission from Standard and Poor’s


