Bainbridge Real Estate 2014 1st Quarter Review

Local Eats on Bainbridge Island
April 21, 2014
May | Two Extremes
June 6, 2014
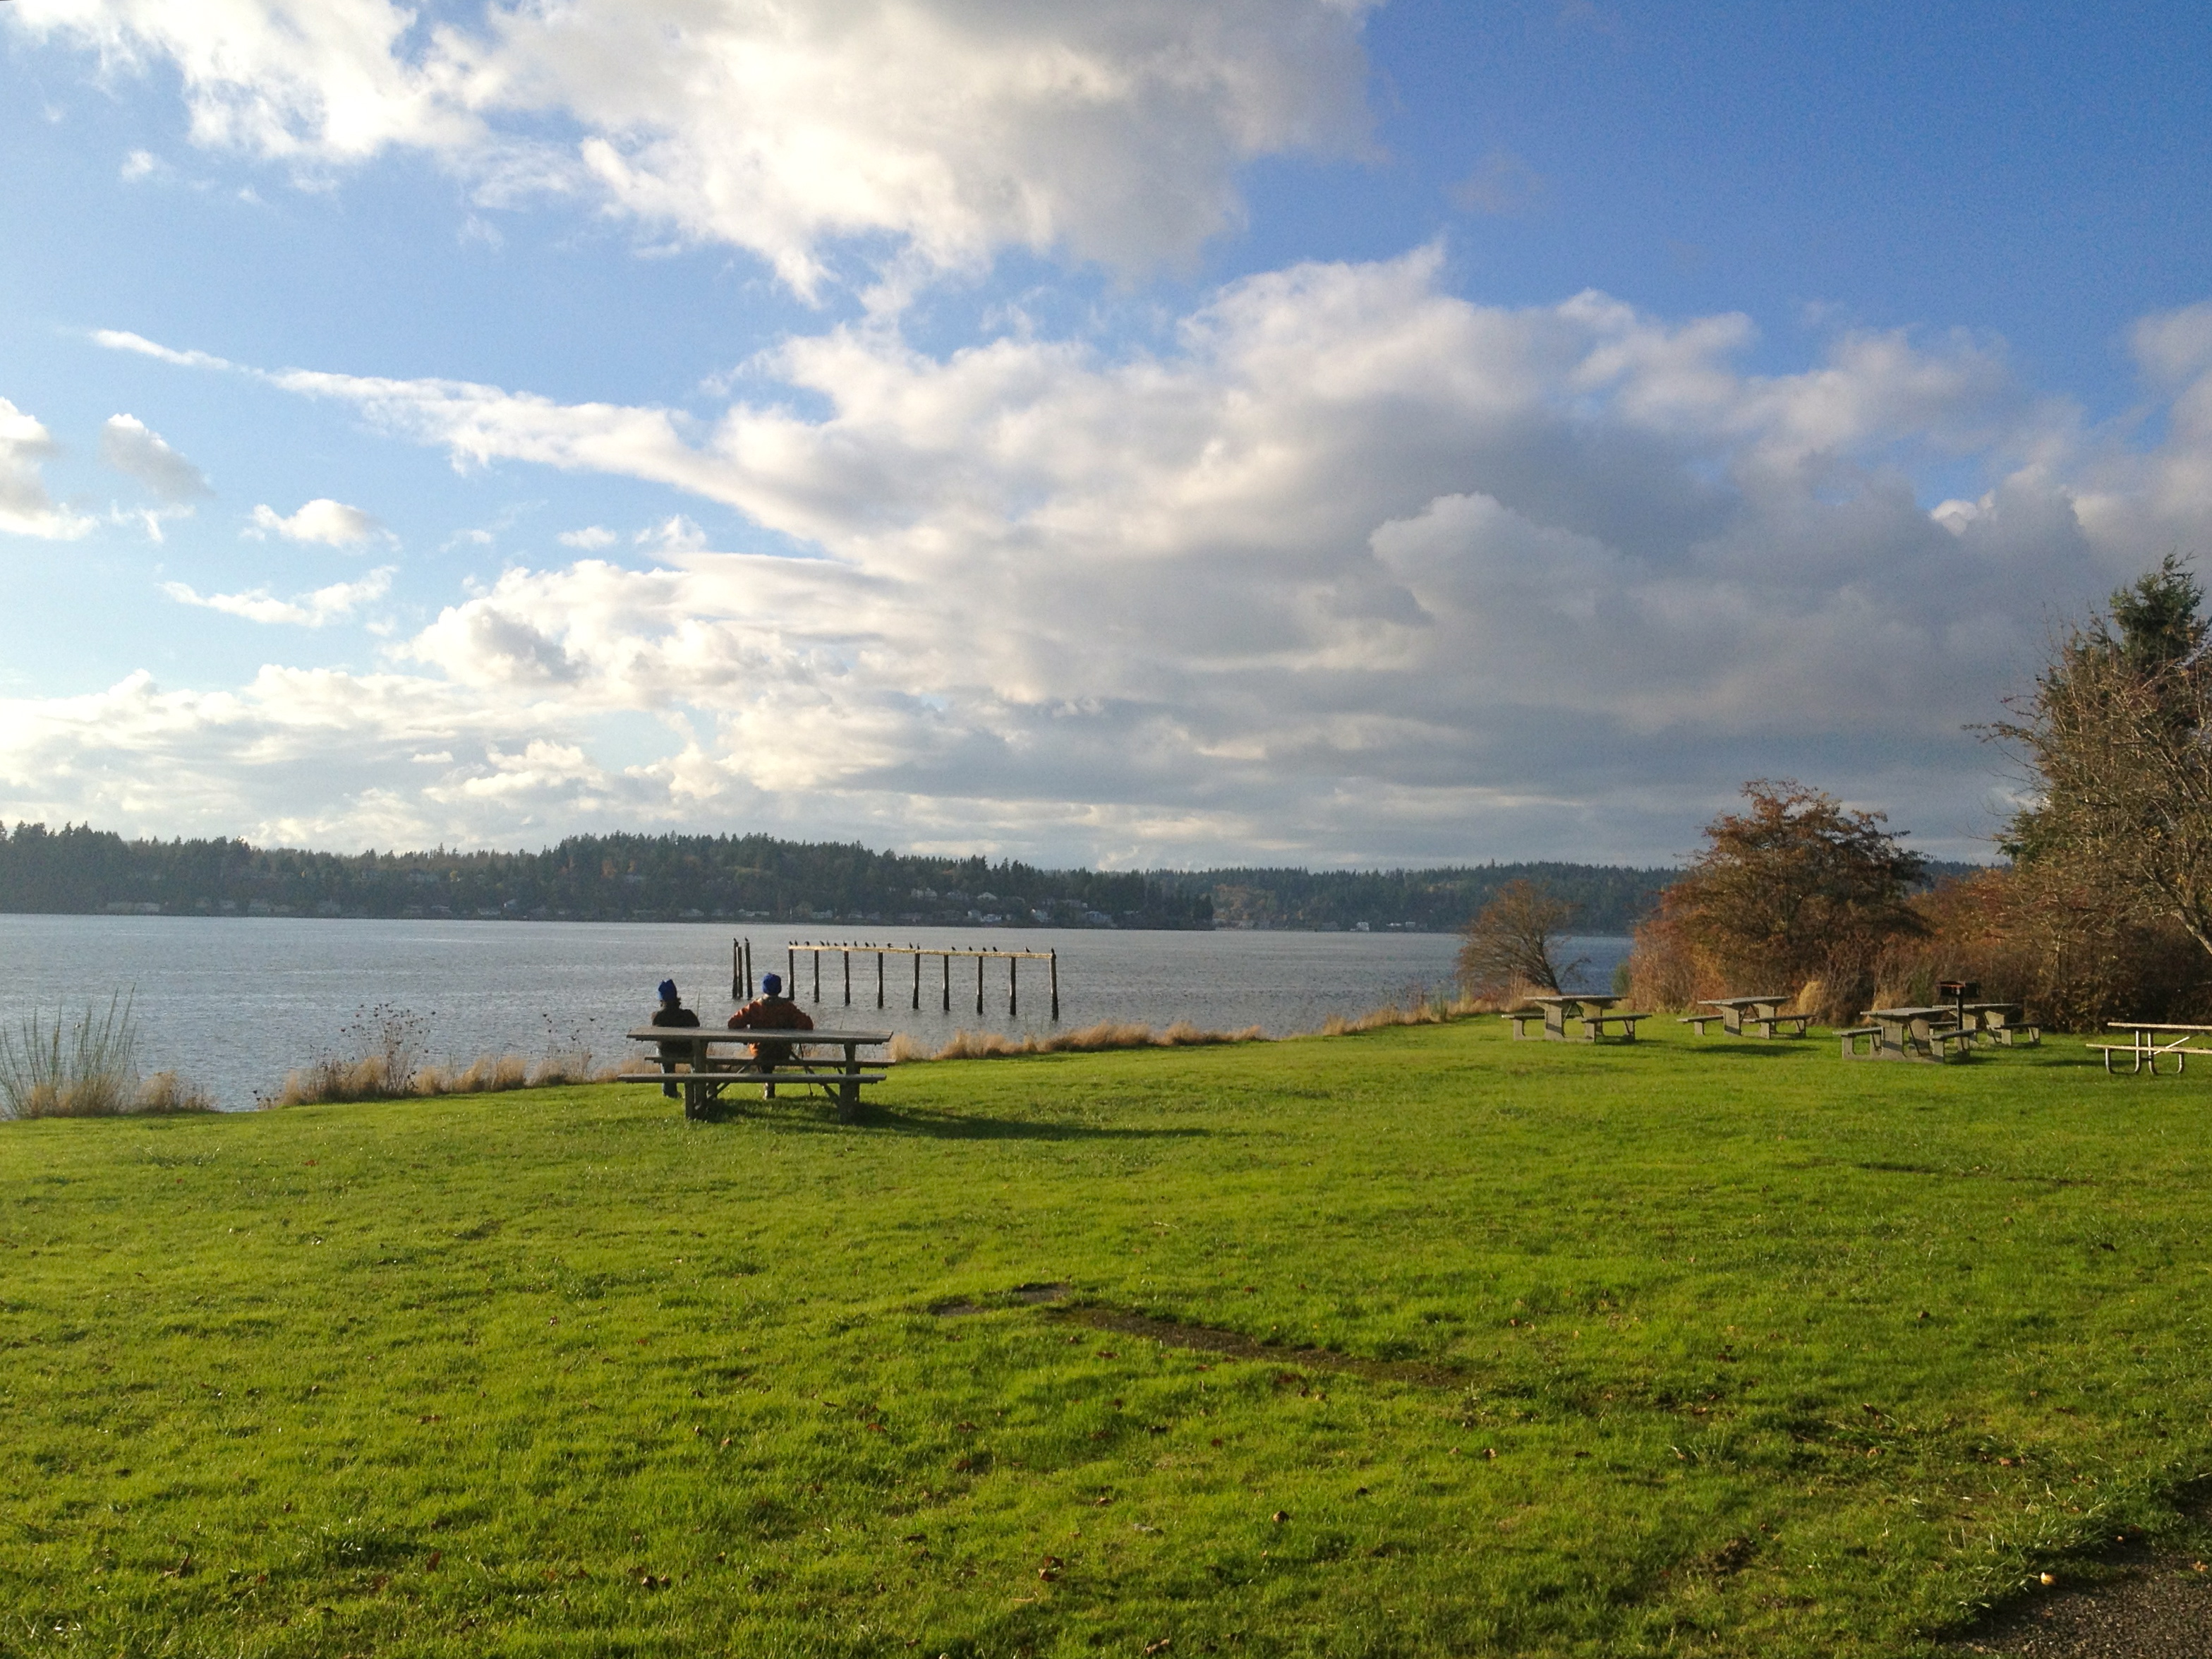
Waiting for the Bloom
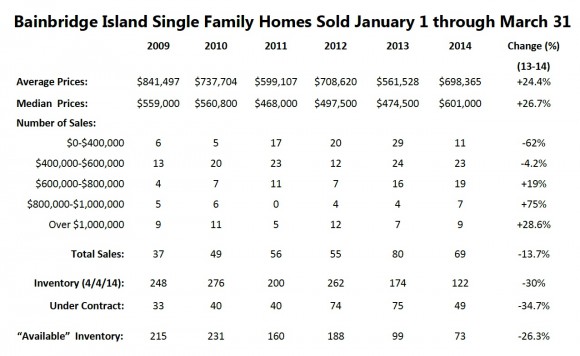
The inventory bloom, that is. Last year’s 1st Quarter in Review highlighted the increase in the number of homes sold during that quarter over the same period in the previous year. We probably could have made a similar claim this year because the demand was there, but the number of homes sold actually dropped this year compared to last. (We sold 69 homes in the first quarter of 2014 versus 80 in 2013 – a 14% drop). The reason? Low inventory. You have probably been hearing this (at least if you have been listening to us), so we thought we would take this opportunity to explore it in a bit more detail, as inventory numbers have been defining our market in recent quarters.
The Power of Buyers
Buyers were precious commodities in 2008, ‘09, ‘10 and even 2011. The growing pool of buyers was concentrated at both ends of the market during 2012, leaving the middle of the market languishing. This improved in 2013, creating a more balanced and, for lack of a better word, healthy market. As “normalcy” continued to assert itself after our recession, the pool of buyers continued to grow but the number of homes coming on the market did not grow along with it. Buyers today are smart, well informed and pretty disciplined in going after (which sometimes means waiting for) what they want. They are willing to rent or stay where they are until the type of home they want comes onto the market. When they see it they move – quickly. There have been instances where we get five new listings in a week and four of those five are sold two weeks later. The problem: we would normally see ten new listings in a typical week, so the competition among those motivated buyers is fiercer than usual.
Limited Availability
If you look at the bottom line of the stats, you see the “available” inventory. These are our active listings; the buyers’ cu rrent choices. Keep in mind this is the total number available from $0 to $10,000,000 and includes “pre-sales” – homes not even built yet! With a mere 73 available listings over all price ranges, buyers do not have many choices. Even at the market peak of 2006, there were 93 homes available in the first quarter (27% more than today).
 Chickens, Eggs & Pricing
Sellers continue to play a crucial role when it comes to inventory, because once they sell they enter the buyer pool and find themselves facing the same limited options as all other buyers. We hear clients ask over and over again, “If I sell, where will I go?” This so-called “chicken and egg” phenomenon is real. Good real estate agents have strategies to mitigate this problem (for example, this is a good market for contingent sales), but it is a stumbling block for many. Also, many people want to downsize and there simply aren’t many homes on the island that meet the requirements of people looking for homes they can live in through some of the transitions they will be facing in the foreseeable future. So pricing strategies are as important as ever. Prices are recovering rapidly from their recession-era lows, but are still far from the peaks we saw in 2006 and 2007 (and even into 2008). People who bought Bainbridge properties between 20 05 and 2008 may very well still be upside down. If they aggressively financed their purchases, taking a paper loss may not even be an option as they may be “short” (with debt that exceeds current value). Other owners are simply waiting for the prices, and their equity, to go back up.
Time Will Help
As we’ve seen with most market eras, time will correct many of these challenges. Prices are going up at a healthy pace and will lure more sellers back to the market. More builders are re-entering the market and some already have mature buyers in mind. The risks, however, are still real. The interest rates may go up more (they are already 1-1.5% higher than their lowest levels) and rising prices may begin to shut certain buyers out. One of the undeniable benefits of our real estate correction was that Bainbridge became affordable to families once again; rising prices may gradually force them back out. It is a very interesting, complicated and exciting time, depending on where one is in the market.
Condos & Land
The condominium market is also very interesting right now. There were 21 sales in the first quarter, up 40% from last year’s 15. Of those 21, 17 were below $500,000 and four were over $1M with nothing in between. Land sales are up 30% from last year and developers are actively looking for potential sites.
Beyond Bainbridge
What’s going on in our neighboring markets? As our market trends usually lag behind Seattle’s, North Kitsap traditionally lags behind us. We’re pleased to report that North Kitsap had a strong first quarter, with sales up 12.5%. Their average price was positive although me-dian price was down 3.5% (2014 first quarter median price was $262,750 versus the 2013 median price of $271,900). That being said, they are currently experiencing a predominately “seller’s market,” which will help bring price points up. So things are getting exciting and looking encouraging throughout the region.
